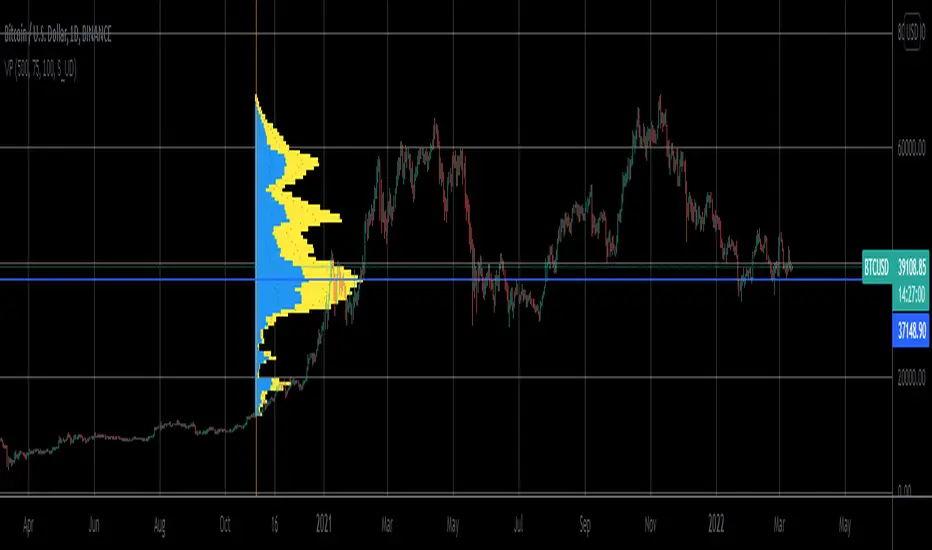
Volume Profile For All AccountsVolume Profile For All Accounts is displaying volume from price perspective. It’s done by summing volume by the “estimated” transaction price. This version is estimating it based on public volume data so it can be used with any account.
Volume Profile is a powerful tool commonly used by PRO users, to disseminate its use also by users who operate on basic volume data, we have prepared a set of scripts:
Volume Profile For All Accounts – Analyze last 50-20000 bars.
Volume Profile From Date For All Accounts – Analyze all bars since start date.
Volume Profile Range For All Accounts – Analyze bars in a range between start and end date.
Traiding View is supporting paid users with Volume Profile on extended volume dataset. We recommend to use it, because of access to more precise data.
Settings:
SCANNER VISUALIZATION
Limit – How many last bars should be taken into account during calculations. For small values, the estimation may differ significantly from the Volume Profile available for Paid Traiding View users.
Rows – Number of rows
Width – Width of the visualization.
Position – Position of the visualization:
S_DU – At START of the area, DOWN first
S_UD – At START of the area, UP first
BE_DU – At BEFORE END of the area, DOWN first
BE_UD – At BEFORE END of the area, UP first
E_DU – At END of the area, DOWN first
E_UD – At END of the area, UP first
Color Up – Color of volume classified as move Up, or Both if separation is off.
Color Down - Color of volume classified as move Down
Color Border – Border color.
Up/Down separate – Draw separate volume classified as Up and Down
Show values – Showing volume values of the bars.
Troubleshooting:
In case of any problems, send error details to the author of the script.
Cari dalam skrip untuk "the script"
KCGmut“KCGmut” stands for “Mutations Of Keltner Center Of Gravity Channel”.
After adding the ‘KeltCOG Width’ label to the KeltCOG, I got the idea of creating a subpanel indicator to show the development of the width-percent in previous periods. After some more thinking, I decided that the development of the COG-width-percent should also be reported and somehow the indicator should report whether the close is over (momentum is up), in (momentum is sideways) or under (momentum is down) the COG ( This is the gray area in the channel).
Borrowing from other scripts:
I tweeked the script of the KeltCOG (published) to calculate the columns and of REVE (also published) to calculate the volume spikes. Because the KeltCOG script had the default option to let the script chose lookback and adapt the width, I decided to not provide inputs to tweek lookback or channel width. Thus, if you use a KeltCOG in default setting, REVE and KCGmut together in the same chart, these will provide consistent complementary information about the candle. This layout has this combination:
I added actual volume to show where volume spikes occur.
Columns
For the channel-width-percent half of the value is used and for the COG-width-percent the whole to get a better image
By plotting the columns of the full width before those of the COG, in two series of positive and negative values, I created the illusion of a column with a different colored patch representing the COG (most are black) at the bottom where it points up (showing momentum is up), in the middle when the close is in the COG (no momentum) or at the top when the close is below the COG (showing momentum is down)
coloring drama
When nothing much happens, i.e. the channels keep the same width of shrink a bit, the columns get an unobtrusive color, black for the small COG patches and bluish gray for the channel columns pointing up or sideways, reddish gray when pointing down. If the COG increases (drama) the patches get colored lime (up), red (down) or orange (sideways, very seldom). If the channel increases, the columns get colored gold (up), maroon (down) or orange (sideways). Because the COG is derived from a Donchian channel, drama means a new high or low in the lookback period. Drama in the KeltCOG channel just means increase in volatility.
histogram showing volume spikes
Blue spikes indicate more then twice as much volume then recently normal, Maroon spikes indicate clear increases less then twice. To prevent the histogram from disappearing behind a column it is plotted first, spikes made longer then the column and also plotted both positive and negative. Single volume spikes don’t mean much, however if these occur in consecutive series and also come together with drama like new highs or increase in volatility, volume is worth noting. I regard such events as ‘voting’, the market ‘votes’ up or down. The REVE analyses these events to asses whether the volume stems from huge institutional traders (‘whales’) or large numbers of small traders (‘muppets’). This might be interesting too.
Remarks about momentum
Like in MACD, momentum has a direction. The difference is that in KCGmut momentum is a choise of the market to move above the COG (uptrend) or in (sideways) or under (downtrend), whereas in MACD the indicator shows the energy with which the market moves up or down. How does the market ‘choose’? The market doesn’t ‘think’, but still it comes to decisions. I see an analogy with the way a swarm of birds decides to go here or there, up or down, or land in a tree. All birds seem to agree but I guess a single bird has not much say in what the swarm does.

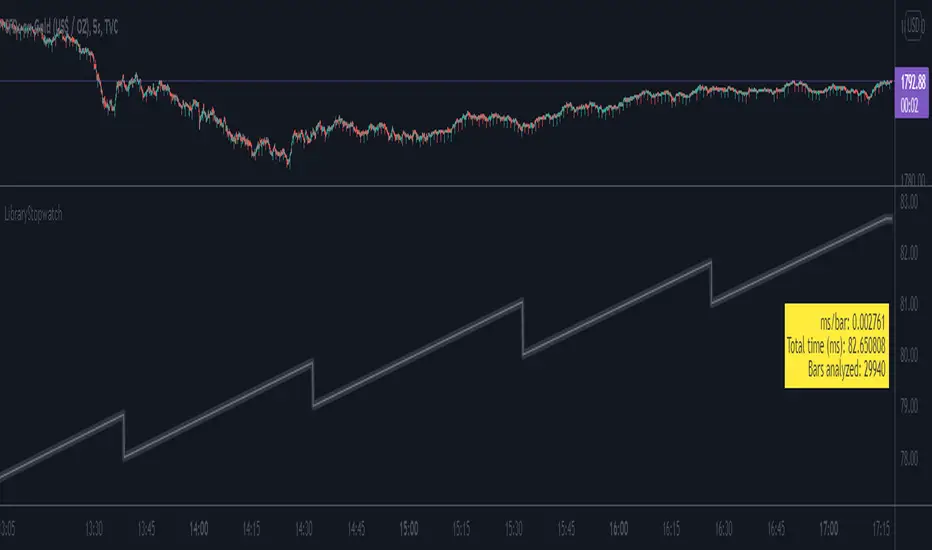
LibraryStopwatchLibrary "LibraryStopwatch"
Provides functions to time the execution of a script.
When timing scripts, keep in mind that the runtime environment is fluid on TradingView. Different servers or server loads will impact execution time.
Look first. Then leap.
stopwatchStats() Times the execution of a script.
Returns: A tuple of four values: timePerBarInMs, totalTimeInMs, barsTimed, barsNotTimed
stopwatch() Times the execution of a script.
Returns: A single value: The time elapsed since the beginning of the script, in ms.
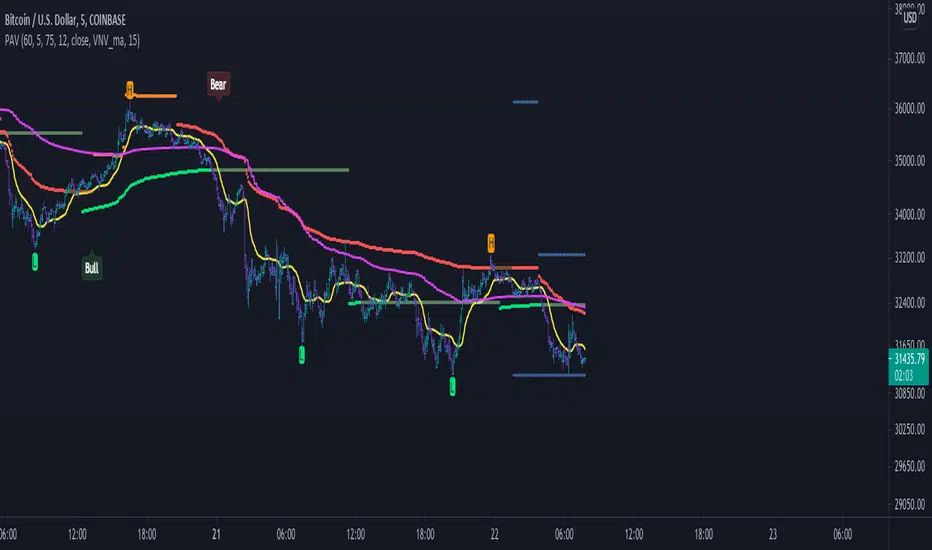
High time frame Pivot Anchored VWAP V1.0Purpose:
-----------
To provide VWAPs anchored on the high and low pivots. I have seen scripts which anchor VWAP on a session or time frame or indeed a time, but not yet one that anchors on pivot points.
Value:
--------
As many have stated, price action tends toward VWAPs. I named the VWAPs anchored on high pivots the Selling VWAP, representing the volume weighted average of the sellers. And the VWAPs anchored on the low pivots, Buying VWAP, representing the volume weighted average of the buyers.
One of these two governs the current price action.
What is unique about this script:
---------------------------------------
- Locates pivots also found in higher time frames (it does not use the Security Function, technically it does not locate high time frame pivots)
- It uses a simple technique to locate the pivots that avoids using "For Loops" , typically used with HTF Pivots and at times can cause time outs
- VWAPs are then anchored on the pivots
- High Pivots are anchored with a VWAP using the High price as the source
- Low Pivots are anchored with a VWAP using the Low price as the source
How to Use It
-----------------
- Choose the higher time frame pivots of interest, the script uses current time frame multiplier
- so on a 1 minute chart, 60 is 1 hour. On a 5 min chart the same multiplier would be 5 hours.
- Choose how many of the higher time frame bars define the pivot, the right side and left side
- the default is 8 and 4, for a 60 multiplier on a 1min chart it implies 4hrs right of the pivot and 8 hrs left of the pivot.
- A Vidya moving average is included
- When the ma crosses over the Selling VWAP then the system is dominated by the buyers and the Buying VWAP provides support
- When the ma crosses under the Buying VWAP then the system is dominated by the sellers and the Selling VWAP provides resistance
It helps by keeping you in a trade, also by using the support/resistance to add to a position.
I make those decisions in the script, and display only the dominating VWAP
Acknowledgements
------------------------
PineCoders for their functions on managing resolution.
LucF for his work on high time frame pivots.
Future considerations
--------------------------
- Provide option to show both VWAPs
- Use a different ma, such as VWMA, or provide a choice.
- Open the script, version 1.0 being what it is
Trend Stability (Expo)
Trend Stability (Expo) is a multifunctional trend trading tool that identifies all aspects of trend trading. The indicator helps traders to stay on the right side of the market, identify retracements, reversals, and trend strength. In addition to that, we have added momentum - moves for traders that want to do trend scalping. The candle coloring displays the current trend and gives early signs of trend reversals and retracements.
➤ All in one trading tool that filters out noise and leaves us with insights that matter.
Real-Time with Alerts
No Repainting
Works on any market and in any timeframe
HOW TO USE
Use the indicator to gain insights into all aspects of trend trading:
Trend Stability/equilibrium
Trend Strength
Trend Retracements
Trend Reversals
Trend Filter
Momentum Moves
INDICATOR IN ACTION
4-hour chart
The setting used on the chart below displays negative momentum-moves with a noise-free positive trend.
I hope you find this indicator useful , and please comment or contact me if you like the script or have any questions/suggestions for future improvements. Thanks!
I will continually work on this indicator, so please share your experience and feedback as it will enable me to make even better improvements. Thanks to everyone that has already contacted me regarding my scripts. Your feedback is valuable for future developments!
-----------------
Disclaimer
Copyright by Zeiierman.
The information contained in my scripts/indicators/ideas does not constitute financial advice or a solicitation to buy or sell any securities of any type. I will not accept liability for any loss or damage, including without limitation any loss of profit, which may arise directly or indirectly from the use of or reliance on such information.
All investments involve risk, and the past performance of a security, industry, sector, market, financial product, trading strategy, or individual’s trading does not guarantee future results or returns. Investors are fully responsible for any investment decisions they make. Such decisions should be based solely on an evaluation of their financial circumstances, investment objectives, risk tolerance, and liquidity needs.
My scripts/indicators/strategies/ideas are only for educational purposes!
ACCESS THE INDICATOR
• Contact me on TradingView or use the links below

Harmonic PatternsHello Traders,
This is Harmonic Pattern script . I made this script long time ago and now pubished it for the community. it can find & show following patterns:
- Gartley
- Butterfly
- Bat
- Alternate Bat
- Crab
- Deep Crab
- Shark
- Cypher
- Double Top
- Double Bottom
- ABCD
only ABCD patterns is not enabled by default, you can enable if you want.
The script has many features in it, so you have many options. lets see them
ZigZag Period : is the period for zig zag that is used to find harmonic patterns.
Error Rate % : the patterns may not be perfect and we need to use a threshold. with this option you can set error rate
Deep Search: if you enable this option then the script check combination with old zigzag points. an example is under the explanation part
Pattern Prediction : if you set this option then while price is moving the script checks the possible next patterns that can be possible (shows first possible one). an example is under the explanation part
Show ZigZag: you have option to see zigzag
Show Pattern Names: you have option to see Pattern names
Remove Old Pattern Names : old found patterns can stay on the chart or you have option to delete from the chart by this option
Show Harmonics: you have option to show patterns
Show Targets: you have option to see the target and stop-loss level by each harmonic
Show Statistics: you can see the statictics about harmonic patterns on current chart
Show Full Statistics: you can see the statictics about harmonic patterns on current chart in details
"Stop-loss ATR Len" and "Stop-loss ATR Mult" is used to calculate stop-loss levels
and many options for visualization and alerts...
The scripts works dynamically in real time, it means it may find different patterns on each candles. if it finds a new one in same direction then old one becomes invalid, you should check the last one.
Lets see some examples:
it changes the colors if price reached the target or stop-loss. blue => reached target, black => stop-loss, and if color was not changed it means it found another harmonic pattern.
if it finds a harmonic pattern then it show entrty level, cancelation level of the pattern, target 1 and target 2
and if price reaches entrty level then it shows targets and stop-loss levels
as written above, t has ability to predict patterns if you enable this option:
Deep search is used to find patterns by some old zigzag levels as seen in following screenshot:
it can show full statistics if you enable it in the options:
The source code is hidden but it's free script. so like it/favorite this script, apply it to your chart and start using it ;)
Special thanks to my friend @gornidah who helped while developing the script!
Enjoy!

Fractals (Expo)
Fractals (Expo) make use of fractals to identify trends and reversals. The indicator is designed to adapt smoothly and quickly to significant price moves in order to identify trend reversals as well as filtering out noise in an established trend. The indicator is simple to use and understand therefore valuable to all trading styles.
The user has the ability to enable a custom input source which gives the user great flexibility and full control over what the calculations should be based on. The default input source is fractals from the swing points of the market.
Real-Time Trend Alerts
No Repainting
Works on any market and in any timeframe
HOW TO USE
Use the indicator to gain insights into trends and trend reversals.
Identify Trends
Identify Trend reversals
Use it as a Trend filter
INDICATOR IN ACTION
Daily Chart
I hope you find this indicator useful , and please comment or contact me if you like the script or have any questions/suggestions for future improvements. Thanks!
I will continually work on this indicator, so please share your experience and feedback as it will enable me to make even better improvements. Thanks to everyone that has already contacted me regarding my scripts. Your feedback is valuable for future developments!
-----------------
Disclaimer
Copyright by Zeiierman.
The information contained in my scripts/indicators/ideas does not constitute financial advice or a solicitation to buy or sell any securities of any type. I will not accept liability for any loss or damage, including without limitation any loss of profit, which may arise directly or indirectly from the use of or reliance on such information.
All investments involve risk, and the past performance of a security, industry, sector, market, financial product, trading strategy, or individual’s trading does not guarantee future results or returns. Investors are fully responsible for any investment decisions they make. Such decisions should be based solely on an evaluation of their financial circumstances, investment objectives, risk tolerance, and liquidity needs.
My scripts/indicators/strategies/ideas are only for educational purposes!
ACCESS THE INDICATOR
• Contact me on TradingView or use the links below

Buy & Sell Order (Expo)
Buy/Sell Order (Expo) is a unique and important indicator that provides information about Buy & Sell order patterns. The indicator helps to identify real-time large Buy & Sell Orders that have a significant impact on the price. These buy and sell orders can be the start of a trend move or a sign of reversal.
The indicator is divided into a Sell-side (red zone) and a Buy-side (green zone) in order to highlight the different order flows. Greater candlesticks mean significant buy/sell orders! These are the ones we want to keep track of.
The price levels where a large Buy or Sell order occurs at should be considered as key levels. These key- levels are often re-tested in the future. Traders should keep track of them.
Real-Time
No Repainting
Works on any market and in any timeframe
HOW TO USE
Identify Large Buy / Sell Order
Identify potential trend move
Identify potential reversal
INDICATOR IN ACTION
1-hour chart
I hope you find this indicator useful , and please comment or contact me if you like the script or have any questions/suggestions for future improvements. Thanks!
I will continually work on this indicator, so please share your experience and feedback as it will enable me to make even better improvements. Thanks to everyone that has already contacted me regarding my scripts. Your feedback is valuable for future developments!
-----------------
Disclaimer
Copyright by Zeiierman.
The information contained in my scripts/indicators/ideas does not constitute financial advice or a solicitation to buy or sell any securities of any type. I will not accept liability for any loss or damage, including without limitation any loss of profit, which may arise directly or indirectly from the use of or reliance on such information.
All investments involve risk, and the past performance of a security, industry, sector, market, financial product, trading strategy, or individual’s trading does not guarantee future results or returns. Investors are fully responsible for any investment decisions they make. Such decisions should be based solely on an evaluation of their financial circumstances, investment objectives, risk tolerance, and liquidity needs.
My scripts/indicators/strategies/ideas are only for educational purposes!
ACCESS THE INDICATOR
• Contact me on TradingView or use the links below

Trend & Contrarian (Expo)Trend & Contrarian (Expo) is a powerful trend tool with adaptive contrarian- signals. A strong trend is displayed by the background color and the unique Trend dots/line can be used to confirm a strong trend or to identify early trend reversals. The contrarian-signals are adapting dynamically to price moves and should be used as 'preparation' or 'warning' prior to trigger, should be confirmed by a trend reversals signal or by other indicators.
The contrarian signals should only be used if the user fully understands how they work, please test the feature before entering a trade based on it. However, these signals can be very valuable if used correctly.
Green background color ➞ Strong Positive Trend
Red background color ➞ Strong Negative Trend
No background color? ➞ No strong trend. The Trend Dots/line determine the trend
HOW TO USE
Identify strong trends
Identify trend reversals
Identify contrarian signals
INDICATOR IN ACTION
4-hour chart
I hope you find this indicator useful , and please comment or contact me if you like the script or have any questions/suggestions for future improvements. Thanks!
I will continually work on this indicator, so please share your experience and feedback as it will enable me to make even better improvements. Thanks to everyone that has already contacted me regarding my scripts. Your feedback is valuable for future developments!
-----------------
Disclaimer
Copyright by Zeiierman.
The information contained in my scripts/indicators/ideas does not constitute financial advice or a solicitation to buy or sell any securities of any type. I will not accept liability for any loss or damage, including without limitation any loss of profit, which may arise directly or indirectly from the use of or reliance on such information.
All investments involve risk, and the past performance of a security, industry, sector, market, financial product, trading strategy, or individual’s trading does not guarantee future results or returns. Investors are fully responsible for any investment decisions they make. Such decisions should be based solely on an evaluation of their financial circumstances, investment objectives, risk tolerance, and liquidity needs.
My scripts/indicators/strategies/ideas are only for educational purposes!
ACCESS THE INDICATOR
• Contact me on TradingView or use the links below

Trend Average (Expo)
Trend Average (Expo) measures the overall trend strength and how strong the current price move/momentum is. The color of the average helps to identify the strength and momentum of the trend.
The user can enable Bar Color that coloring the candlesticks based on the trend strength.
The user can choose between different average calculations, such as SMA, WMA, HMA, to mention a few.
This indicator is for those that don't want to have the Trend Oscillator (Expo) but still want to keep track of the trend strength and direction. There is a minor difference in how the trend is calculated due to the nature of input variables.
HOW TO USE
Identify the trend strength and direction
Identify current momentum
INDICATOR IN ACTION
Daily chart
I hope you find this indicator useful , and please comment or contact me if you like the script or have any questions/suggestions for future improvements. Thanks!
I will continually work on this indicator, so please share your experience and feedback as it will enable me to make even better improvements. Thanks to everyone that has already contacted me regarding my scripts. Your feedback is valuable for future developments!
-----------------
Disclaimer
Copyright by Zeiierman.
The information contained in my scripts/indicators/ideas does not constitute financial advice or a solicitation to buy or sell any securities of any type. I will not accept liability for any loss or damage, including without limitation any loss of profit, which may arise directly or indirectly from the use of or reliance on such information.
All investments involve risk, and the past performance of a security, industry, sector, market, financial product, trading strategy, or individual’s trading does not guarantee future results or returns. Investors are fully responsible for any investment decisions they make. Such decisions should be based solely on an evaluation of their financial circumstances, investment objectives, risk tolerance, and liquidity needs.
My scripts/indicators/strategies/ideas are only for educational purposes!
ACCESS THE INDICATOR
• Contact me on TradingView or use the links below

Trend Oscillator (Expo)Trend Oscillator (Expo) measures the overall trend strength and how strong the current price move/momentum is. The indicator is leading since it can signal a possible trend change that is yet to start. The color of the histogram and its value helps to gauge the strength and momentum of the trend.
The user can enable Bar Color that coloring the candlesticks based on the trend strength.
The user can choose between different trend calculations, such as smoothed trend, volume-weighted trend, a non-lagging trend, to mentions a few.
DIVERGENCES
All types of oscillators produce divergences and so does Trend Oscillator (Expo). Divergences occur when the oscillator deviates from the trending price action. Bullish divergence is then when the trending price makes a lower low but the oscillator makes a higher low. Bearish divergence is then when the trending price makes a higher high but the oscillator makes a lower high.
HOW TO USE
Identify the trend strength and direction
Identify current momentum
Identify potential trend reversals
Identify Overbought and Oversold areas
INDICATOR IN ACTION
1 min chart
I hope you find this indicator useful , and please comment or contact me if you like the script or have any questions/suggestions for future improvements. Thanks!
I will continually work on this indicator, so please share your experience and feedback as it will enable me to make even better improvements. Thanks to everyone that has already contacted me regarding my scripts. Your feedback is valuable for future developments!
-----------------
Disclaimer
Copyright by Zeiierman.
The information contained in my scripts/indicators/ideas does not constitute financial advice or a solicitation to buy or sell any securities of any type. I will not accept liability for any loss or damage, including without limitation any loss of profit, which may arise directly or indirectly from the use of or reliance on such information.
All investments involve risk, and the past performance of a security, industry, sector, market, financial product, trading strategy, or individual’s trading does not guarantee future results or returns. Investors are fully responsible for any investment decisions they make. Such decisions should be based solely on an evaluation of their financial circumstances, investment objectives, risk tolerance, and liquidity needs.
My scripts/indicators/strategies/ideas are only for educational purposes!
ACCESS THE INDICATOR
• Contact me on TradingView or use the links below

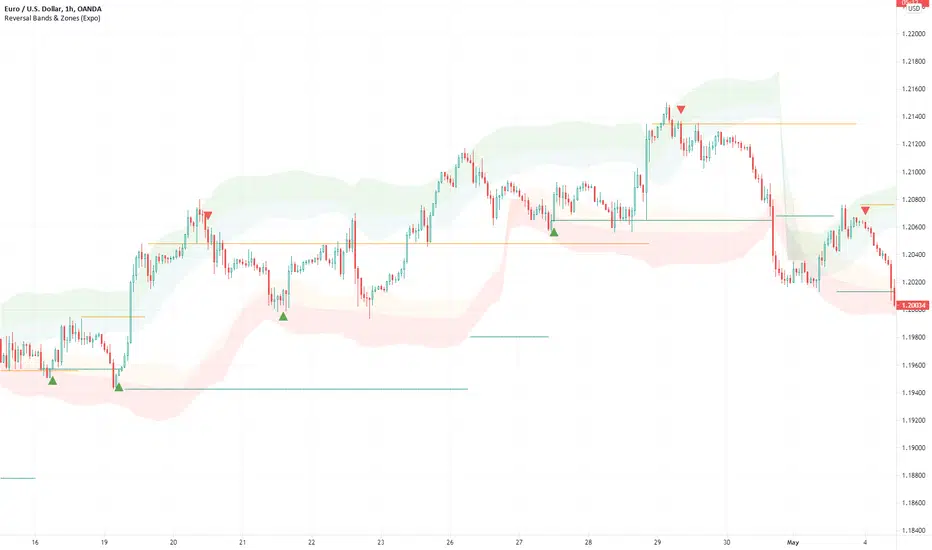
Reversal Bands & Zones (Expo) "It has never been easier to find high probability trades"
Reversal Bands & Zones (Expo) is an algorithm that analyzes the market in real-time and identifies reversal points, key market zones, and trends. The advanced and unique reversal bands act as support & resistance zones, and together with the trend tracking feature, it serves as a trend confirmation. The real-time market zones are displayed where there is a high probability of finding support/resistance. The algorithm does also map out key pivot levels based on the current market structure.
> Reversal points and key market zones have alerts.
Real-time
No repainting
Works on any market and in any timeframe
The indicator can be used standalone or as a part of your current trading strategy.
☖ Reversals
The algorithm identifies areas of potential turning points, these are displayed as Upper and Lower Reversal Cloud. When the price hits the cloud and bounces off there is a high probability that the price will reverse. If the price stays in the reversal cloud, there is a high probability that a trend is forming.
☖ Trends
Positive Trend: If the price is in or close to the upper green reversal band and above the trend- tracking line, we can be sure that the market is in a positive trend until the price crosses down from the reversal cloud and the trend tracking line.
NegativeTrend: If the price is in or close to the lower red reversal band and below the trend- tracking line, we can be sure that the market is in a negative trend until the price crosses up from the reversal cloud and the trend tracking line.
☖ Zones
"It hasn't been easier to display, in real-time, one of the most important and useful technical analysis, namely key support and resistance zones"
The algorithm analyzes the market structure in real-time and maps out key supply/resistance and demand/support zones. The user gets an instant understanding of the market structure. Support and resistance can be used to determine the range of a market, to trade reversals, bounces, or breakouts.
☖ Pivots
The indicator does also displays key pivot levels. Pivots can be used to determine the range of a market, to trade reversals, bounces, or breakouts.
HOW TO USE
- Use the indicator to identify reversals.
- Use the indicator to identify the range of the market.
- Use the indicator to identify key support/resistance zones.
- Use the indicator to identify trends.
INDICATOR IN ACTION
1-hour chart
I hope you find this indicator useful , and please comment or contact me if you like the script or have any questions/suggestions for future improvements. Thanks!
I will continually work on this indicator, so please share your experience and feedback as it will enable me to make even better improvements. Thanks to everyone that has already contacted me regarding my scripts. Your feedback is valuable for future developments!
-----------------
Disclaimer
Copyright by Zeiierman.
The information contained in my scripts/indicators/ideas does not constitute financial advice or a solicitation to buy or sell any securities of any type. I will not accept liability for any loss or damage, including without limitation any loss of profit, which may arise directly or indirectly from the use of or reliance on such information.
All investments involve risk, and the past performance of a security, industry, sector, market, financial product, trading strategy, or individual’s trading does not guarantee future results or returns. Investors are fully responsible for any investment decisions they make. Such decisions should be based solely on an evaluation of their financial circumstances, investment objectives, risk tolerance, and liquidity needs.
My scripts/indicators/ideas are only for educational purposes!
ACCESS THE INDICATOR
• Contact me on TradingView or use the links below
ATR + PSAR Trailing Stop (Expo)This ATR + PSAR Trailing Stop indicator is unique. It comes with new ways of calculating ATR and PSAR to enhance performance and accuracy as well as give clarity in trends. The indicator can be used standalone or as a part of your current trading strategy.
ATR + PSAR Trailing Stop (Expo) is a trailing stop indicator that combines ATR and PSAR to enhance the calculation of the trailing stop. This indicator works well in all types of markets, for example, in a trading range or in a trending market, etc.
The user can choose between the following ATR Settings:
Quick ATR
Adaptive ATR
Follow the price closely - ATR
Standard ATR
Trend ATR
The user can enable Trend ATR which displays the overall market structure. If the Trend ATR line is above the price we have a negative market structure, and if the Trend ATR line is below the price we have a positive market structure.
Real-time
No repainting
Works on any market and in any timeframe
HOW TO USE
- Use the ATR + PSAR Trailing Stop as a stop-loss.
- Use the indicator for taking a position when price crosses the ATR trailing line or taking a position when price crosses the PSAR circles.
- Use the indicator to identify the current market structure and trend.
The indicator can be used standalone or as a part of your current trading strategy.
INDICATOR IN ACTION
1-hour chart
I hope you find this indicator useful , and please comment or contact me if you like the script or have any questions/suggestions for future improvements. Thanks!
I will continually work on this indicator, so please share your experience and feedback as it will enable me to make even better improvements. Thanks to everyone that has already contacted me regarding my scripts. Your feedback is valuable for future developments!
-----------------
Disclaimer
Copyright by Zeiierman.
The information contained in my scripts/indicators/ideas does not constitute financial advice or a solicitation to buy or sell any securities of any type. I will not accept liability for any loss or damage, including without limitation any loss of profit, which may arise directly or indirectly from the use of or reliance on such information.
All investments involve risk, and the past performance of a security, industry, sector, market, financial product, trading strategy, or individual’s trading does not guarantee future results or returns. Investors are fully responsible for any investment decisions they make. Such decisions should be based solely on an evaluation of their financial circumstances, investment objectives, risk tolerance, and liquidity needs.
My scripts/indicators/ideas are only for educational purposes!
ACCESS THE INDICATOR
• Contact me on TradingView or use the links below
Rolling ATR Channel (Expo)Rolling ATR Channel (Expo) is a sophisticated indicator that identifies the underlying trend as well as identifies ATR based trading ranges. In a trending market, the price will be within the Upper or Lower band. If the market is in a trading range , the price will bounce between the upper and lower ATR zones, until the price breaks through and creates a new trend. The user will no longer have to guess in which state the market is in, the indicator displays it clearly.
So, the indicator displays real-time Range (ATR based) support and resistance zones as well as if the market is in a trend.
If you know the current market state, you have the ability to choose the most applicable market strategy.
Real-time
No repainting
Works on any market and in any timeframe
HOW TO USE
- Use the indicator to identify trading range support and resistance zones.
- Use the indicator to identify when the price breaks through the trading range.
- Use the indicator to identify if the market is in a trend.
INDICATOR IN ACTION
4 Hour chart
I hope you find this indicator useful , and please comment or contact me if you like the script or have any questions/suggestions for future improvements. Thanks!
I will continually work on this indicator, so please share your experience and feedback as it will enable me to make even better improvements. Thanks to everyone that has already contacted me regarding my scripts. Your feedback is valuable for future developments!
-----------------
Disclaimer
Copyright by Zeiierman.
The information contained in my scripts/indicators/ideas does not constitute financial advice or a solicitation to buy or sell any securities of any type. I will not accept liability for any loss or damage, including without limitation any loss of profit, which may arise directly or indirectly from the use of or reliance on such information.
All investments involve risk, and the past performance of a security, industry, sector, market, financial product, trading strategy, or individual’s trading does not guarantee future results or returns. Investors are fully responsible for any investment decisions they make. Such decisions should be based solely on an evaluation of their financial circumstances, investment objectives, risk tolerance, and liquidity needs.
My scripts/indicators/ideas are only for educational purposes!
-----------------
ACCESS THE INDICATOR
• Contact me on TradingView or use the links below

Tweezer Top & Tweezer Bottom Pattern (Expo)Tweezer Top/Bottom Pattern (Expo) indicator identifies real-time Tweezer Top and Tweezer Bottom in any market and in any timeframe. This is an enhanced version of the pattern which enables higher accuracy, and noise filtering. In addition to that, Tweezer Levels can be displayed which can be used in many different ways, for instance, as a stop loss level, or to confirm the signal.
The ideal Tweezer pattern includes that the wicks should be 100% the same length. However, that rarely happens. So in this enhanced version, the user can set the maximum change that is allowed between the wicks.
To enhance the signal accuracy a Bullish engulfing and Bearish engulfing filter can be toggled on. So a signal will only be displayed if an engulfing candle is in play.
HOW TO USE
Tweezer Top/Bottom should be used together with KEY market levels or with KEY supply/demand zones.
Enter Long: if a Tweezer Bottom signal occurs at a KEY Level or on a KEY supply/demand zone.
Target: The first target should be the nearest resistance level or supply zone. The second target should be the next resistance level or supply zone, and so on.
Enter Short: if a Tweezer Top signal occurs at a KEY Level or on a KEY supply/demand zone.
Target: The first target should be the nearest support level or demand zone. The second target should be the next support level or demand zone, and so on.
Stop Loss: The Tweezer levels can be used as a stop loss.
Remember: Use the indicator together with KEY levels or KEY Supply/Demand Zones.
INDICATOR IN ACTION
4 Hour chart
I hope you find this indicator useful , and please comment or contact me if you like the script or have any questions/suggestions for future improvements. Thanks!
I will continually work on this indicator, so please share your experience and feedback as it will enable me to make even better improvements. Thanks to everyone that has already contacted me regarding my scripts. Your feedback is valuable for future developments!
-----------------
Disclaimer
Copyright by Zeiierman.
The information contained in my scripts/indicators/ideas does not constitute financial advice or a solicitation to buy or sell any securities of any type. I will not accept liability for any loss or damage, including without limitation any loss of profit, which may arise directly or indirectly from the use of or reliance on such information.
All investments involve risk, and the past performance of a security, industry, sector, market, financial product, trading strategy, or individual’s trading does not guarantee future results or returns. Investors are fully responsible for any investment decisions they make. Such decisions should be based solely on an evaluation of their financial circumstances, investment objectives, risk tolerance, and liquidity needs.
My scripts/indicators/ideas are only for educational purposes!
-----------------
ACCESS THE INDICATOR
• Contact me on TradingView or use the links below

Bull/Bear Probability [Anan]Hello Friends,,,
===================================
This indicator is based on Bayes' Theorem and is fully based on probabilities.
===================================
Formula For Bayes' Theorem:
P(Bull|Bear) = P(Bear∣Bull) * P(Bull) / P(Bear)
where:
Bull and Bear are events and P is probability
P(Bull|Bear) is the posterior probability, the probability of Bull after taking into account Bear
P(Bear∣Bull) is the conditional probability or likelihood, the degree of belief in Bear given that proposition of Bull belief (Bull true)
P(Bull) is the prior probability, the probability of Bull belief
P(Bear) is the prior probability, the probability of Bear belief
===================================
The indicator output 2 trend lines and (Bull/Bear) Signal :
Bull/Bear Probability Trend :
when the price is above it = Up Trend
when the price is below it = Down Trend
Bull/Bear Probability Trend Moving Average :
when the price is above it = Up Trend
when the price is below it = Down Trend
(Bull/Bear) Signal :
when Probability Trend Moving Average crossover Probability Trend = Bull Signal
when Probability Trend Moving Average crossunder Probability Trend = Bear Signal
===================================
Disclaimer:
This script is for informational and educational purposes only.
Use of the script does not constitutes professional and/or financial advice.
You alone the sole responsibility of evaluating the script output and risks associated with the use of the script.
===================================
Thanks to my friends dgtrd because he inspired me about probability, take a look at his scripts.
===================================

Supply & Demand Zones - ShortTerm (Expo) "It hasn't been easier to display, in real-time, one of the most important and useful technical analysis, namely supply/demand zones. This algorithm analyzes the market structure in real-time and maps out key supply and demand zones for you. "
Supply/Demand Zones - ShortTerm (Expo) analyze the short-term market structure in real-time and maps out key supply and demand zones. The user gets an instant understanding of the short-term market structure.
The indicator identifies short-term zones where demand overwhelms supply which is driving the price up, or where supply overwhelms demand which is driving the price down. It makes sense to buy at a demand zone and to sell at a supply zone, but keep in mind that fresh zones are more effective than retested ones. They can be used as entry zones for a continuing trend or as reversal zones for a changing trend.
--> The indicator displays up to 5 zones , which one of them (the blue one) can be customized. Labels with price levels can be enabled. Flexible source input- and zone settings.
-->The indicator can be used standalone or as a part of your current trading strategy.
Real-time
No repainting
Works on any market
HOW TO USE
1. Use the indicator to identify key short-term supply and demand zones.
2. Use the indicator to confirm the existence, or a continuation, of a trend or a trend reversal.
3. Use the indicator to identify potential breakouts.
INDICATOR IN ACTION
4-hour chart
I hope you find this indicator useful , and please comment or contact me if you like the script or have any questions/suggestions for future improvements. Thanks!
I will continually work on this indicator , so please share your experience and feedback as it will enable me to make even better improvements. Thanks to everyone that has already contacted me regarding my scripts. Your feedback is valuable for future developments!
ACCESS THE INDICATOR
• Contact me on TradingView or use the links below
-----------------
Disclaimer
Copyright by Zeiierman.
The information contained in my scripts/indicators/ideas does not constitute financial advice or a solicitation to buy or sell any securities of any type. I will not accept liability for any loss or damage, including without limitation any loss of profit, which may arise directly or indirectly from the use of or reliance on such information.
All investments involve risk, and the past performance of a security, industry, sector, market, financial product, trading strategy, or individual’s trading does not guarantee future results or returns. Investors are fully responsible for any investment decisions they make. Such decisions should be based solely on an evaluation of their financial circumstances, investment objectives, risk tolerance, and liquidity needs.
My scripts/indicators/ideas are only for educational purposes!
Supply/Demand Zones (Expo)"It hasn't been easier to display, in real-time, one of the most important and useful technical analysis, namely supply/demand zones. This algorithm analyzes the market structure in real-time and maps out key supply and demand zones for you. - "
Supply/Demand Zones (Expo) analyze the market structure in real-time and maps out key supply and demand zones. The user gets an instant understanding of the current market structure.
The indicator identifies zones where demand overwhelms supply which is driving the price up, or where supply overwhelms demand which is driving the price down. It makes sense to buy at a demand zone and to sell at a supply zone, but keep in mind that fresh zones are more effective than retested ones. They can be used as entry zones for a continuing trend or as reversal zones for a changing trend.
--> The indicator displays 3 zones, which one of them (the blue one) can be customized. Labels with price levels can be enabled.
--> The indicator can be used standalone or as a part of your current trading strategy.
Real-time
No repainting
Works on any market
HOW TO USE
1. Use the indicator to identify key supply and demand zones.
2. Use the indicator to confirm the existence, or a continuation, of a trend or a trend reversal.
3. Use the indicator to identify potential breakouts.
INDICATOR IN ACTION
1-hour chart
I hope you find this indicator useful , and please comment or contact me if you like the script or have any questions/suggestions for future improvements. Thanks!
I will continually work on this indicator, so please share your experience and feedback as it will enable me to make even better improvements. Thanks to everyone that has already contacted me regarding my scripts. Your feedback is valuable for future developments!
ACCESS THE INDICATOR
• Contact me on TradingView or use the links below
-----------------
Disclaimer
Copyright by Zeiierman.
The information contained in my scripts/indicators/ideas does not constitute financial advice or a solicitation to buy or sell any securities of any type. I will not accept liability for any loss or damage, including without limitation any loss of profit, which may arise directly or indirectly from the use of or reliance on such information.
All investments involve risk, and the past performance of a security, industry, sector, market, financial product, trading strategy, or individual’s trading does not guarantee future results or returns. Investors are fully responsible for any investment decisions they make. Such decisions should be based solely on an evaluation of their financial circumstances, investment objectives, risk tolerance, and liquidity needs.
My scripts/indicators/ideas are only for educational purposes!

High & Low Of Custom Session - OpeningRange Breakout (Expo)High & Low Of Custom Session - OpeningRange Breakout (Expo) prints the high and the low of a custom session.
I use the indicator to trade the re-test of opening range (high/low) as well as breakouts from the opening range. The same logic can be applied to the session you have chosen.
HOW TO USE
1. Use the indicator to trade the re-tests of the session range.
2. Use the indicator to trade breakouts of session range.
INDICATOR IN ACTION
1-min chart
I hope you find this indicator useful , and please comment or contact me if you like the script or have any questions/suggestions for future improvements. Thanks!
I will continually work on this indicator, so please share your experience and feedback as it will enable me to make even better improvements. Thanks to everyone that has already contacted me regarding my scripts. Your feedback is valuable for future developments!
-----------------
Disclaimer
Copyright by Zeiierman.
The information contained in my scripts/indicators/ideas does not constitute financial advice or a solicitation to buy or sell any securities of any type. I will not accept liability for any loss or damage, including without limitation any loss of profit, which may arise directly or indirectly from the use of or reliance on such information.
All investments involve risk, and the past performance of a security, industry, sector, market, financial product, trading strategy, or individual’s trading does not guarantee future results or returns. Investors are fully responsible for any investment decisions they make. Such decisions should be based solely on an evaluation of their financial circumstances, investment objectives, risk tolerance, and liquidity needs.
My scripts/indicators/ideas are only for educational purposes!

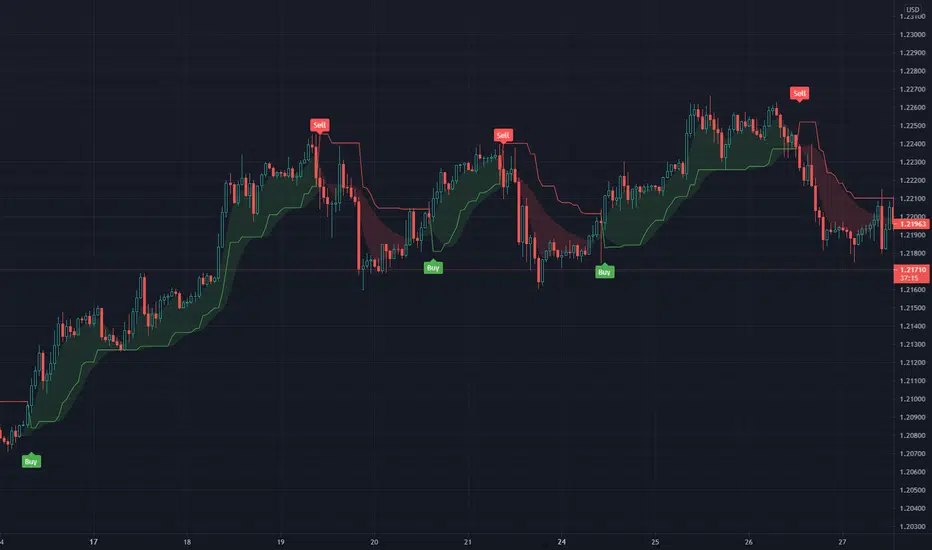
Momentum Oscillator [Dynamic & Flow] (Expo)Momentum Oscillator -Dynamic & Flow (Expo) is a fast-moving, sensitive oscillator that makes use of momentum in various ways. The indicator has two additional layers (Buy & Sell moves) and (Extremes) which makes it reacts quickly to price changes.
The indicator displays overbought and oversold areas as well as extreme areas and how aggressive buyers and sellers are. It does also displays potential reversal points or potential pullbacks.
The following momentum modes are displayed:
1. Where momentum begins
2. Where momentum is strong
3. Where momentum begins to stall
Where momentum begins to stall is displayed as a red and green color on the momentum line .
Where momentum begins (light green and light red color) and where it's strong (dark green and dark red color) is displayed as upper and lower lines. The darker these lines are the stronger is the momentum.
Potential reversal or pullback is displayed as a blue color on the signal line.
♢ The indicator has inbuilt suggested buy & sell- and stop-loss signals. These signals have flexible settings, so a fast, slow, and sensitive mode can be enabled.
DIVERGENCES
All types of momentum oscillators produce divergences and so does Momentum Oscillator Dynamic & Flow (Expo) . Divergences occur when the oscillator deviates from the trending price action. Bullish divergence is then when the trending price makes a lower low but the oscillator makes a higher low. Bearish divergence is then when the trending price makes a higher high but the oscillator makes a lower high.
HOW TO USE
1. Use the indicator to identify overbought/oversold areas, as well as extreme modes.
2. Use the indicator to display momentum in various ways.
3. Use the indicator to confirm the existence, or a continuation, of a trend.
4. Use the indicator to identify potential reversal points or potential pullbacks.
INDICATOR IN ACTION
4-hour chart
I hope you find this indicator useful , and please comment or contact me if you like the script or have any questions/suggestions for future improvements. Thanks!
I will continually work on this indicator, so please share your experience and feedback as it will enable me to make even better improvements. Thanks to everyone that has already contacted me regarding my scripts. Your feedback is valuable for future developments!
ACCESS THE INDICATOR
• Contact me on TradingView or use the links below
-----------------
Disclaimer
Copyright by Zeiierman.
The information contained in my scripts/indicators/ideas does not constitute financial advice or a solicitation to buy or sell any securities of any type. I will not accept liability for any loss or damage, including without limitation any loss of profit, which may arise directly or indirectly from the use of or reliance on such information.
All investments involve risk, and the past performance of a security, industry, sector, market, financial product, trading strategy, or individual’s trading does not guarantee future results or returns. Investors are fully responsible for any investment decisions they make. Such decisions should be based solely on an evaluation of their financial circumstances, investment objectives, risk tolerance, and liquidity needs.
My scripts/indicators/ideas are only for educational purposes!

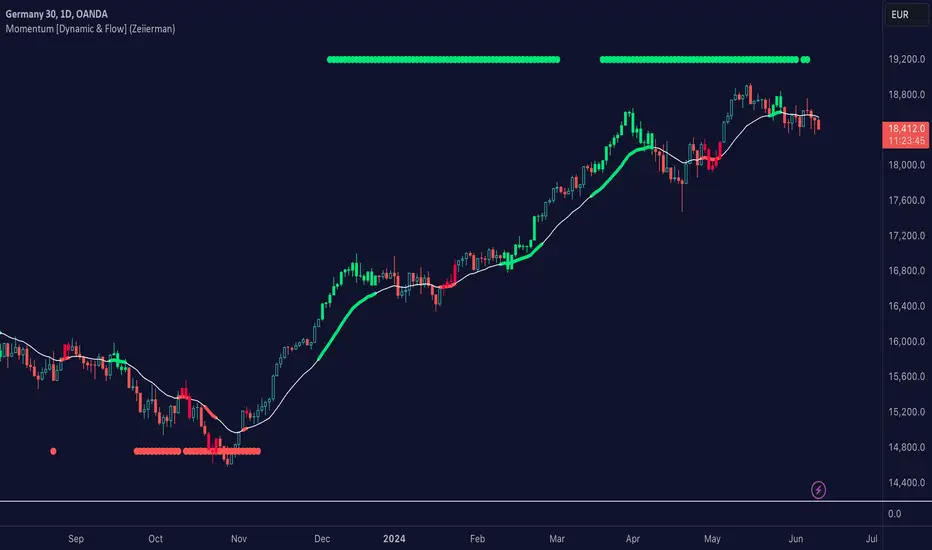
Momentum [Dynamic & Flow] (Expo)Momentum Dynamic & Flow (Expo) is a useful indicator that displays the momentum - as dynamic & flow, as well as where the momentum begins to stall.
♢ Momentum -Dynamic can be used to identify overbought and oversold areas.
♢ Momentum -Flow can be used to identify if the current trend has strong momentum.
♢ When momentum begins to stall it can be identifiable turning points, areas of congestion. However, it's not a sign that the trend is over, see it as "heads up" This is displayed with green and red colors on the moving average.
Momentum can be displayed at the top/bottom of the chart or above/below the bars. The user can also display momentum as BGcolor.
The indicator can be used standalone or as a part of your current trading strategy
HOW TO USE
1. Use the indicator to identify where the momentum stall.
2. Use the indicator to identify overbought/oversold areas with momentum -Dynamic.
3. Use the indicator to confirm the existence, or a continuation, of a trend with momentum -Flow.
INDICATOR IN ACTION
1-hour chart
4-hour chart
I hope you find this indicator useful , and please comment or contact me if you like the script or have any questions/suggestions for future improvements. Thanks!
I will continually work on this indicator, so please share your experience and feedback as it will enable me to make even better improvements. Thanks to everyone that has already contacted me regarding my scripts. Your feedback is valuable for future developments!
-----------------
Disclaimer
Copyright by Zeiierman.
The information contained in my scripts/indicators/ideas does not constitute financial advice or a solicitation to buy or sell any securities of any type. I will not accept liability for any loss or damage, including without limitation any loss of profit, which may arise directly or indirectly from the use of or reliance on such information.
All investments involve risk, and the past performance of a security, industry, sector, market, financial product, trading strategy, or individual’s trading does not guarantee future results or returns. Investors are fully responsible for any investment decisions they make. Such decisions should be based solely on an evaluation of their financial circumstances, investment objectives, risk tolerance, and liquidity needs.
My scripts/indicators/ideas are only for educational purposes!
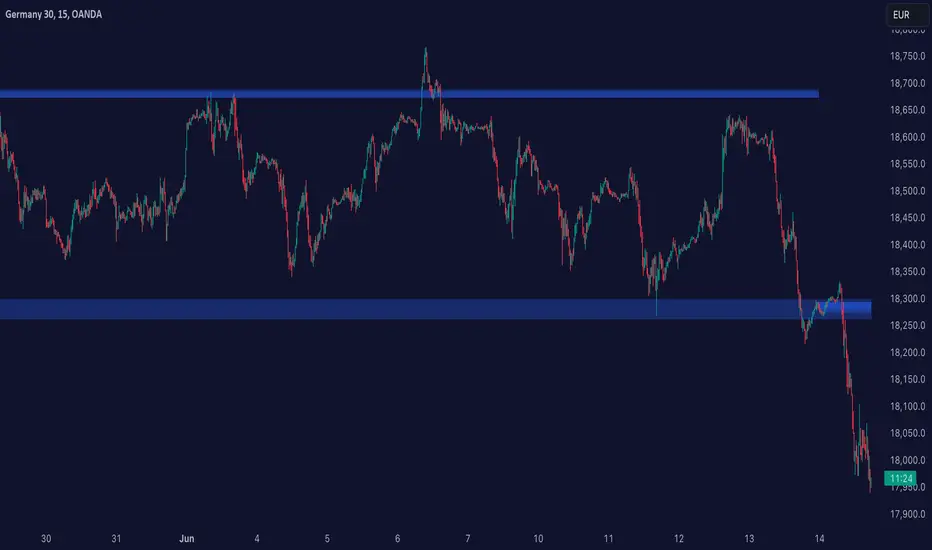
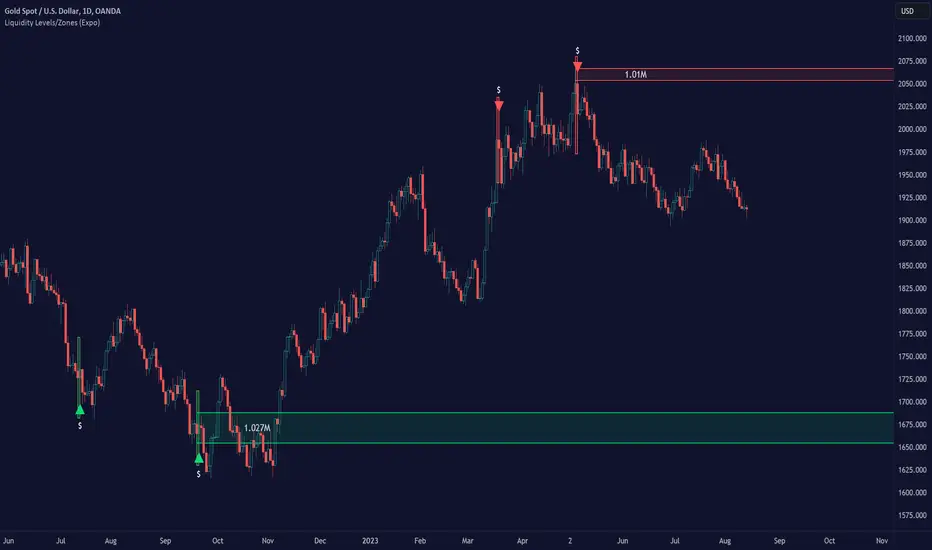
Liquidity Levels/Zones (Expo)Liquidity Levels/Zones (Expo) automatically identifies and displays key liquidity levels/zones.
Liquidity describes the extent to which an asset can be bought and sold quickly, without affecting the price. It is a measure of how many buyers and sellers are present, and whether transactions can take place easily.
Levels/Zones are displayed where there is a significant level of trading activity and when there is both high supply and demand for an asset, security, or contract. These levels can leave clues for future price behavior and act as support/resistance zones. The trading activity can confirm the existence, or a continuation, of a trend or a trend reversal.
The user can modify the settings so that short- term, medium-term, and long- term liquidity levels/zones are displayed.
The indicator can be used standalone or as a part of your current trading strategy.
Real-time
No repainting
Works on any market
HOW TO USE
1. Use the indicator to identify key liquidity levels/zones.
2. Use the indicator to identify high trading activity.
3. Use the indicator to confirm the existence, or a continuation, of a trend or a trend reversal.
INDICATOR IN ACTION
1-hour chart
I hope you find this indicator useful , and please comment or contact me if you like the script or have any questions/suggestions for future improvements. Thanks!
I will continually work on this indicator, so please share your experience and feedback as it will enable me to make even better improvements. Thanks to everyone that has already contacted me regarding my scripts. Your feedback is valuable for future developments!
ACCESS THE INDICATOR
• Contact me on TradingView or use the links below
-----------------
Disclaimer
Copyright by Zeiierman.
The information contained in my scripts/indicators/ideas does not constitute financial advice or a solicitation to buy or sell any securities of any type. I will not accept liability for any loss or damage, including without limitation any loss of profit, which may arise directly or indirectly from the use of or reliance on such information.
All investments involve risk, and the past performance of a security, industry, sector, market, financial product, trading strategy, or individual’s trading does not guarantee future results or returns. Investors are fully responsible for any investment decisions they make. Such decisions should be based solely on an evaluation of their financial circumstances, investment objectives, risk tolerance, and liquidity needs.
My scripts/indicators/ideas are only for educational purposes!
[Trend] Support- & Resistance Levels/Zones (Expo)- Trend - Support & Resistance Levels/Zones (Expo) automatically identifies and displays support and resistance levels based on the direction of the trend.
Levels/Zones are displayed where there is a high probability that price will find Support in positive trends and Resistance in negative trends.
Trend Cloud and Trend Detection Line can be enabled.
The indicator can be used standalone or as a part of your current trading strategy.
Real-time
No repainting
Works on any market
HOW TO USE
1. Use the indicator to identify where the price can find support and resistance Levels/Zones in trends.
2. Use the indicator to identify the trend direction.
INDICATOR IN ACTION
4 hour chart
I hope you find this indicator useful , and please comment or contact me if you like the script or have any questions/suggestions for future improvements. Thanks!
I will continually work on this indicator, so please share your experience and feedback as it will enable me to make even better improvements. Thanks to everyone that has already contacted me regarding my scripts. Your feedback is valuable for future developments!
ACCESS THE INDICATOR
• Contact me on TradingView or use the links below
-----------------
Disclaimer
Copyright by Zeiierman.
The information contained in my scripts/indicators/ideas does not constitute financial advice or a solicitation to buy or sell any securities of any type. I will not accept liability for any loss or damage, including without limitation any loss of profit, which may arise directly or indirectly from the use of or reliance on such information.
All investments involve risk, and the past performance of a security, industry, sector, market, financial product, trading strategy, or individual’s trading does not guarantee future results or returns. Investors are fully responsible for any investment decisions they make. Such decisions should be based solely on an evaluation of their financial circumstances, investment objectives, risk tolerance, and liquidity needs.
My scripts/indicators/ideas are only for educational purposes!
